
Innovating your tomorrow

Data Insights
Transform your numbers into clear, analytical reports or actionable Power BI dashboards.
Data Analysis


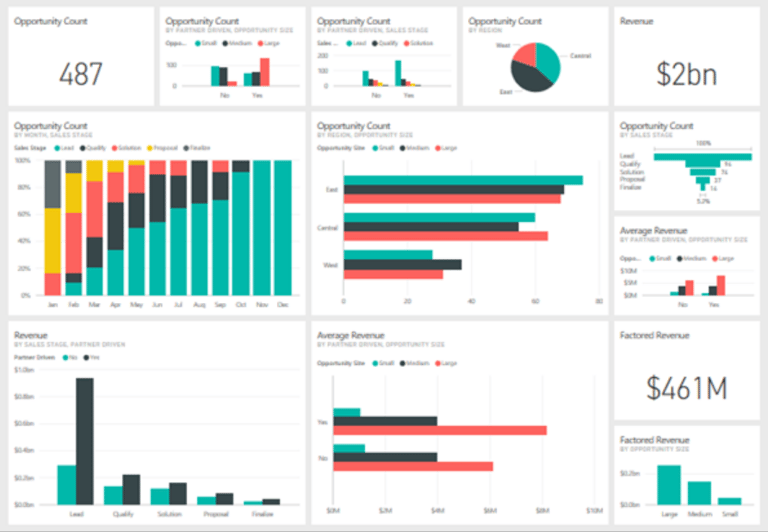
Power BI Reports / Dash Board Design
Business Power BI reports involves a structured process—from understanding business needs to designing visuals and delivering insights. These reports can cover sales, projects, operations, finance, and customer performance.
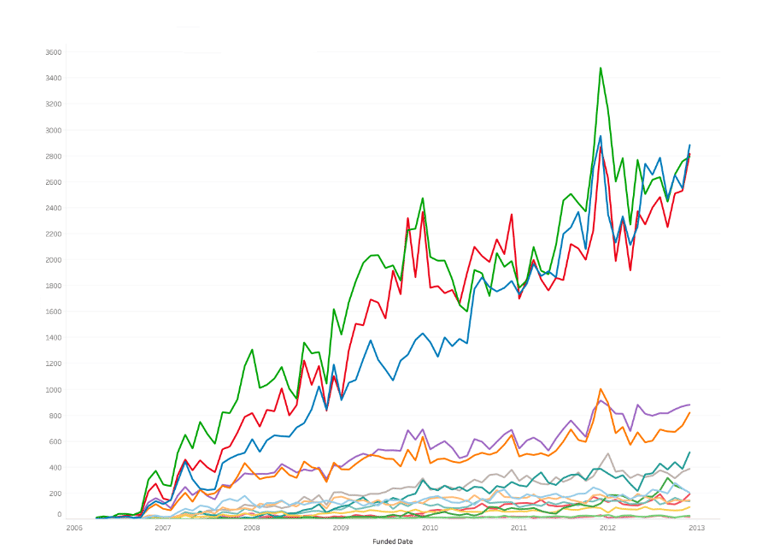
We will examine your raw data to uncover patterns, trends, and insights that support better decision-making. Our Analytics team will combine techniques from statistics, computer science, and business intelligence.
FAQs
What services offered?
We create detailed digital analytics and custom Power BI dashboards.
How to start a project?
Reach out with your data goals and we’ll plan a tailored analytics approach.
Can reports be customized?
Yes, reports and dashboards are fully tailored to your unique business metrics.
What data sources connect?
We integrate multiple data sources for comprehensive insights.
Is ongoing support available?
Yes, we offer maintenance and updates as your needs evolve.

Get in Touch
Questions? Reach out for tailored analytics for your business

